

Overview
As I previously discussed, it’s very common that developers tend to focus their efforts on building and shipping applications and services to production but forget to consider what happens after go-live. It’s easy to dismiss that the solutions being built are going to be supported by someone else. Once the services reach production, an operations team will need the means to understand the system’s state and health to support it efficiently. This is even more relevant when dealing with distributed systems that run in the background. Thus, the importance of implementing proper observability practices in our solutions to allow monitoring, troubleshooting, analysis, and alerting.
I strongly believe in the importance of application-level observability practices. In the past, I’ve written about activity monitoring on Logic Apps, and custom queries of Logic Apps logs. I’ve also covered an approach for correlated structured logging on Azure Functions and wrote a series on a custom distributed tracing in Azure Functions. My previous posts on Logic Apps targeted the consumption SKU, which provided integration with Log Analytics.
With the release of Logic Apps Standard, now Logic Apps run on top of the Azure Functions runtime. This means that traces are sent to Application Insights. Considering these new capabilities, I wanted to explore what can be leveraged on Logic Apps Standard to provide application-level observability.
Throughout this series, I want to share what I’ve found. I aim to provide insights so that architects and developers can incorporate observability practices when designing and building Logic Apps solutions. The series is structured as outlined below:
- Introduction (this article) – describes the built-in observability features available in Logic Apps Standard.
- Reference implementation – shows how these features can be leveraged and implemented.
- Querying and analysing Logic Apps traces – shows how to query and analyse Logic Apps application traces, and how to publish and share queries and charts.
This series describes in detail what I recently presented at the Azure Serverless Conference.
Workflow Run, Trigger History, and Run Identifier
One of the most basic monitoring capabilities of Logic Apps is its built-in workflow run history and trigger history. At the time of writing, the available documentation still refers to Logic Apps consumption SKU. However, most of these features are applicable to Logic Apps Standard as well. The figures below depict the run and trigger history of a workflow.
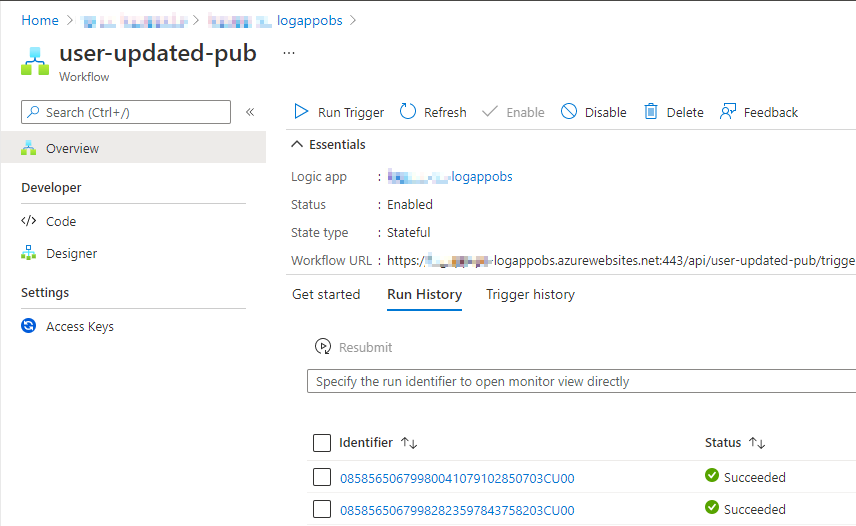
Figure 1. Logic Apps run history
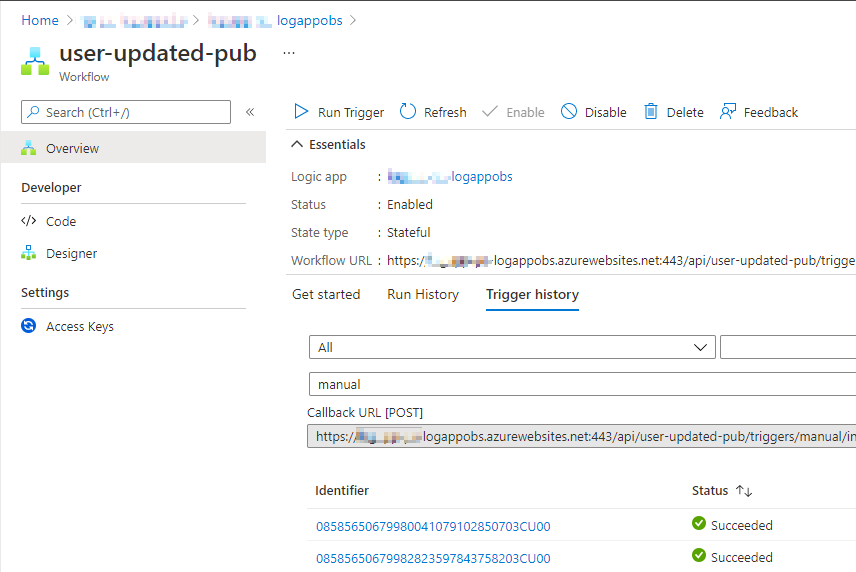
Figure 2. Logic Apps trigger history
It is worth noting that all Logic App workflow run instances have a unique workflow run identifier, which is accessible at run time using the workflow().run.name function. This run identifier is the one that is shown in the run history and allows to run instances to be searched by it, as shown in the picture below.
The instance run, trigger history, and run identifiers are sent to Application Insights traces and can be queried and analysed. I’ll show more on this in the last instalment of the series.
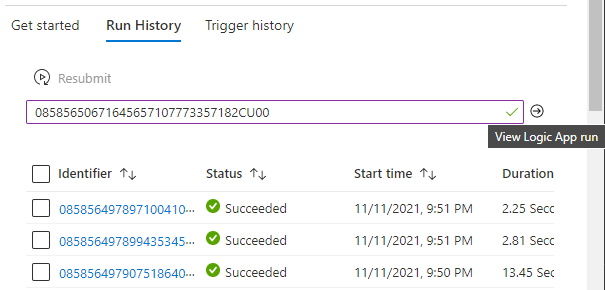
Figure 3. Search by run instance identifier
Trigger and Action Inputs and Outputs
In Logic Apps Standard, workflows can be configured to be stateless or stateful. When a workflow is configured to be stateful, the run view of an instance shows all inputs and outputs for the trigger and every action. It’s worth mentioning that these inputs and outputs are not sent to Application Insights traces but kept in the storage provider configured, typically a storage account.
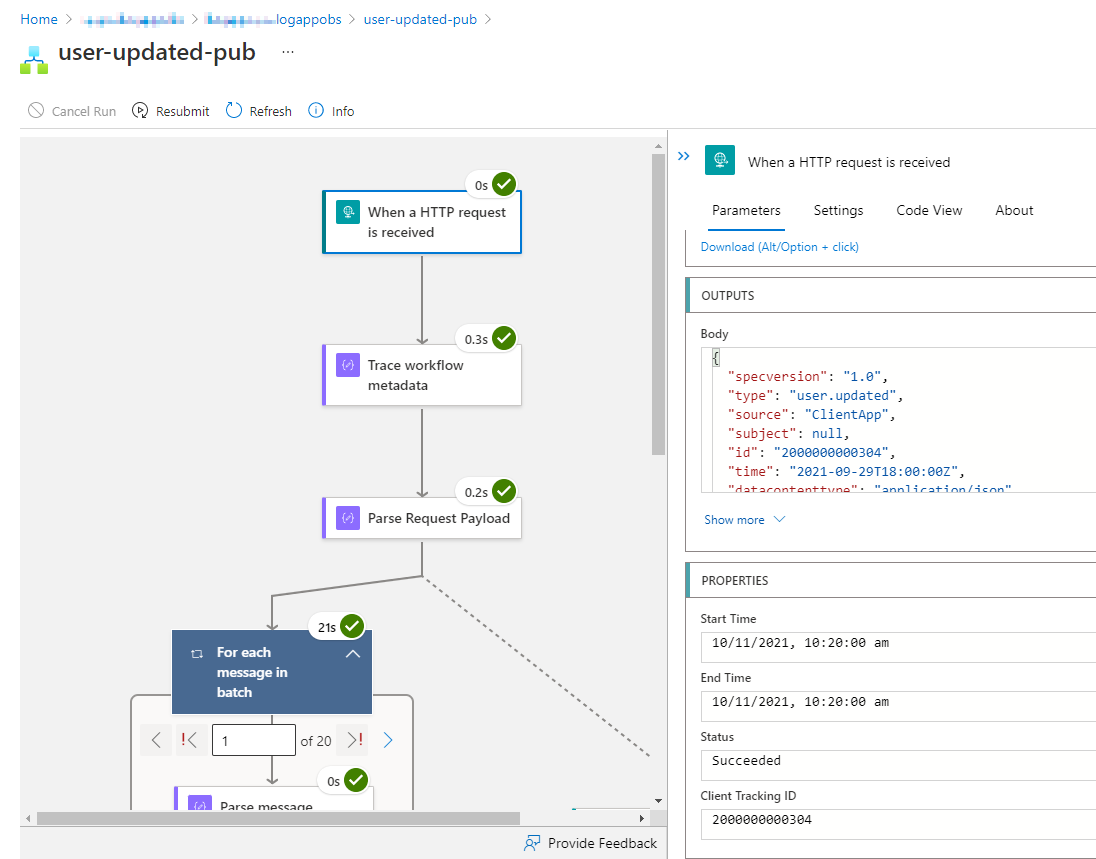
Figure 4. Inputs and outputs of Logic Apps actions
Tip: when processing confidential messages and these must be obfuscated to operators, inputs and outputs of the actions processing these messages must be secured. This can be configured per action as shown in the figure below. More information on this topic can be found in the official documentation.
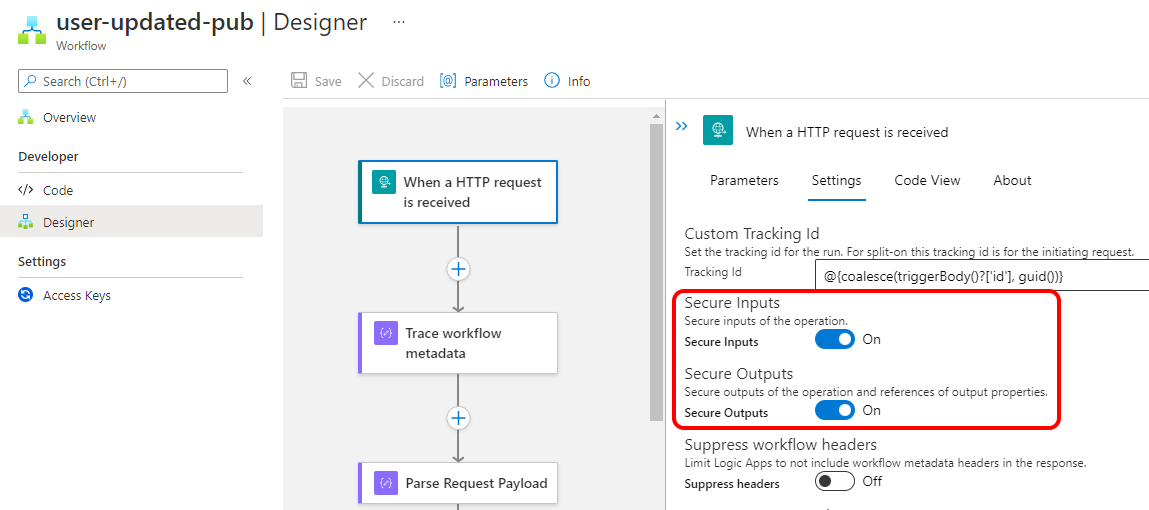
Figure 5. Securing action inputs and outputs
Custom Tracking Id
In addition to the workflow run unique identifier, a custom tracking identifier (clientTrackingId) can be assigned to each workflow run. The custom tracking identifier is configured at design time in the settings tab of the workflow trigger as shown in the figure below.
![]()
Figure 6. Setting a custom tracking id
Tip: when configuring the custom tracking id property, make sure that you are using a defensive approach to avoid trigger failures. Some examples are described below.
-
Always use the ‘
?’ operator when reading object properties to define the custom tracking id. Otherwise, a non-existing property would cause the trigger to fail. -
For cases when the
triggerBodycan be null, e.g. in an HTTP trigger, use thecoalescefunction and define a default value. Otherwise, a null trigger body would cause the trigger to fail, e.g.
"correlation": {
    "clientTrackingId": "@{coalesce(triggerBody()?['id'], guid()))"
}
Code snippet 1. Setting a clientTrackingId property with coalesce
- For those cases when the
triggerBodycan be empty, for instance when using the Service Bus trigger, implement the corresponding validation and set a default value, e.g.
"correlation": {
    "clientTrackingId": "@{if(empty(triggerBody()), guid(), triggerBody()['Properties']?['ClientTrackingId'])}"
}
Code snippet 2. Setting a clientTrackingId property and validating an empty trigger
Once the client tracking id is configured for the workflow, the run view shows the value for the instance as depicted in the figure below. Furthermore, this identifier is available on Application Insights traces, so you can search or filter using this identifier. I’ll show more on this capability later in this series.
![]()
Figure 7. Inspecting the client tracking id in a run view
Tracked Properties
Tracked properties (trackedProperties) allow tracking inputs and outputs of an action in the traces sent to Application Insights. Tracked properties are configured in the settings tab of an action or in the corresponding property in the JSON code behind as shown below.
Tip: given that tracked properties can only track a single action's inputs and outputs, a simple way to track multiple properties for a workflow in one action is to use a compose action to compose a JSON object with all the properties that must be tracked and track the outputs of such action. This approach is shown in the figure and the corresponding JSON code below.
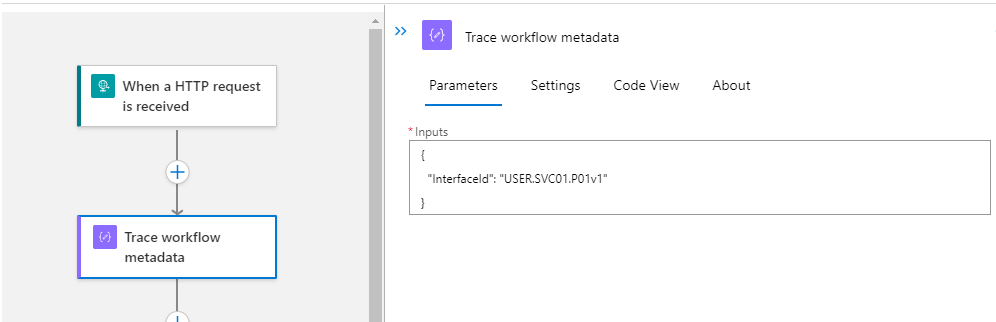
Figure 8. Using a Compose action to track properties
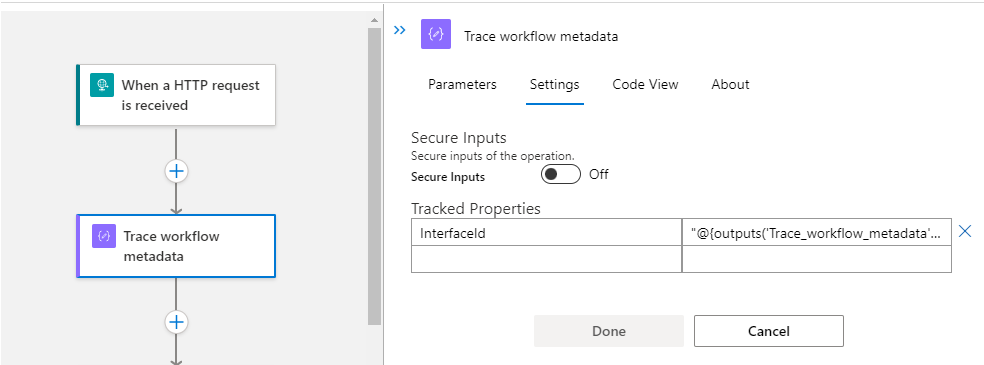
Figure 9. Configuring tracked properties
"Trace_workflow_metadata": {
   "inputs": {
       "InterfaceId": "USER.SVC01.P01.v1"
   },
   "runAfter": {},
   "trackedProperties": {
       "InterfaceId": "@{outputs('Trace_workflow_metadata')?[InterfaceId]}"
   },
   "type": "Compose"
}
Code snippet 3. Configuring trackedProperties
Exception Handling
To implement exception handling in Logic Apps, we can make use of the runAfter property for an action to run after a previous action or scope has a statuses of "Failed", "Skipped", or "TimedOut". This is described in more detail in the official documentation. Additionally, scopes can be used to structure the workflow in a way to have one action that handles exceptions at a scope level. The figures below show exception handling in a workflow.
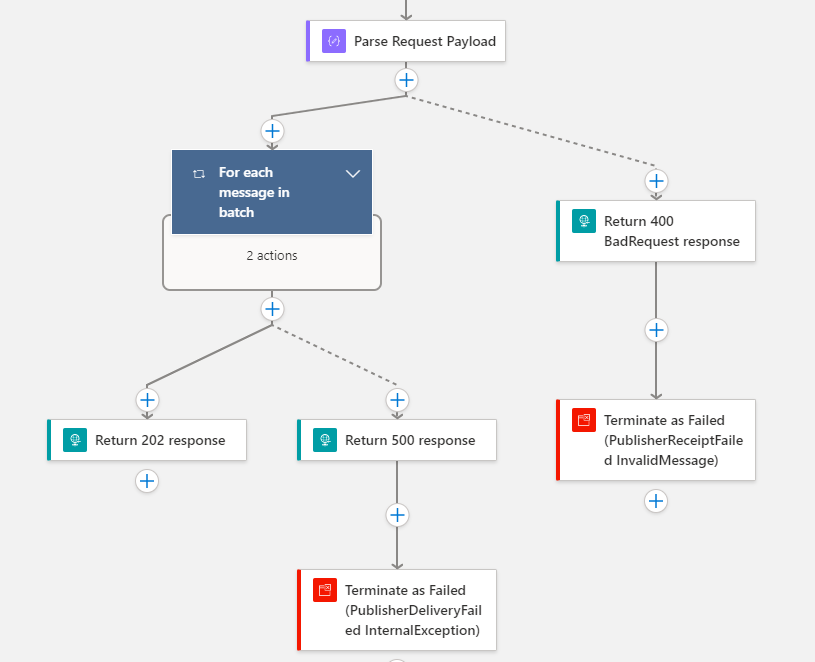
Figure 10. Exception handling using runAfter configuration
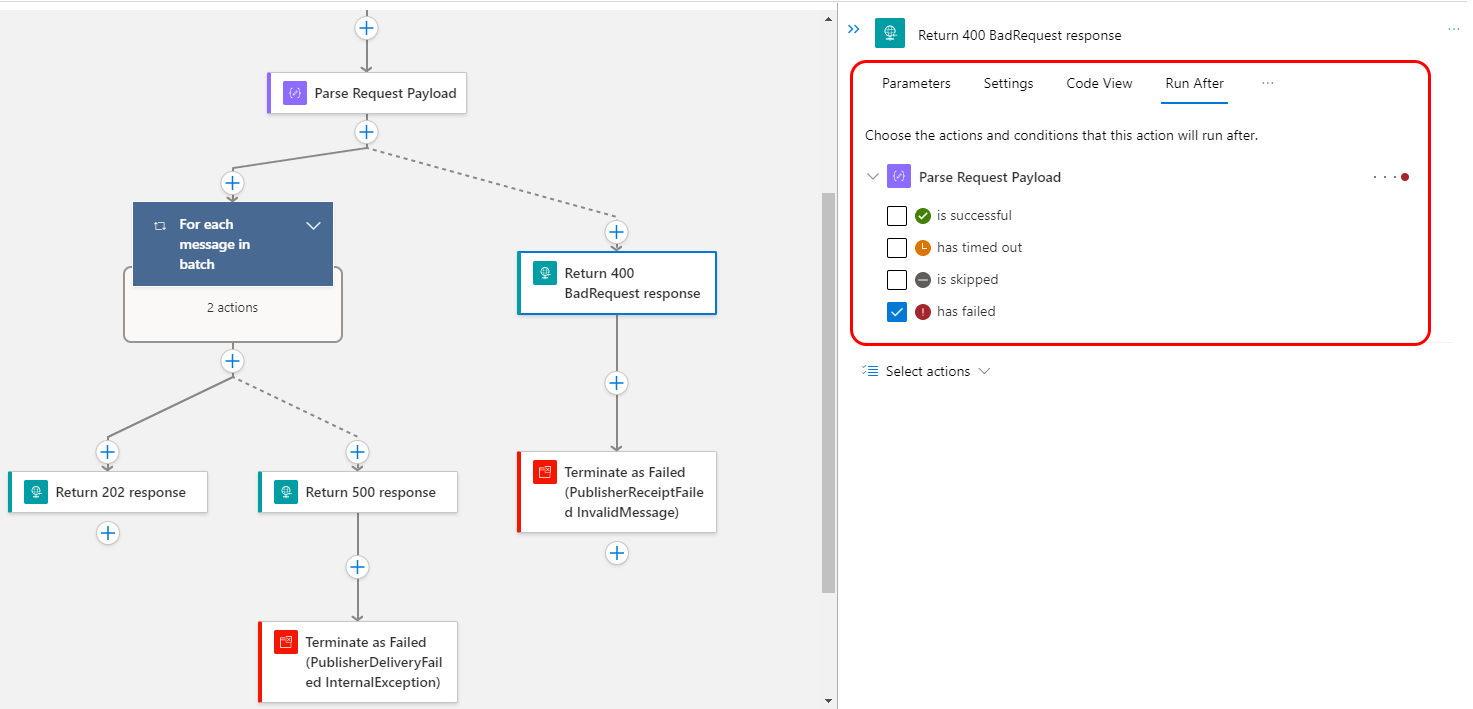
Figure 11. Configuring runAfter settings for an action
Terminating a Workflow
The Terminate action allows finishing the execution of a workflow instance based on business or non-functional requirements. This action allows terminating the workflow instance with different status including: "Succeeded", "Failed", or "Cancelled". When the workflow is terminated as "Failed", an error code and an error message can be added. The workflow termination status, error code, and error message are sent to Application Insights traces.
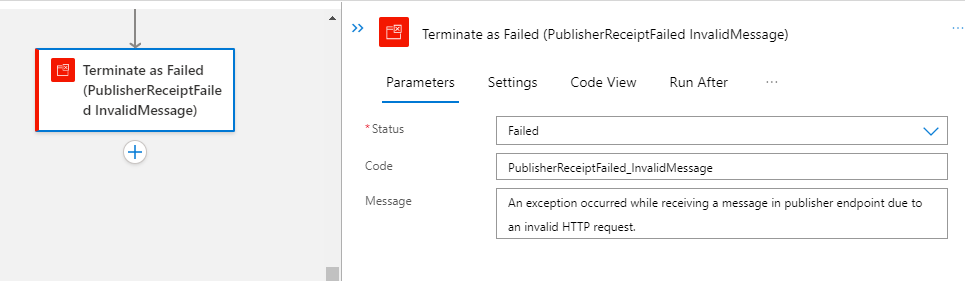
Figure 12. Using a Terminate action
Application Insights Integration
Logic Apps Standard provides integration with Application Insights. All inbuilt workflow tracing logs and metadata like workflow run identifier, custom tracking id, and tracked properties are ingested into Application Insights. All these logs can be queries using Kusto query language (KQL). More information can be found in this blog post.
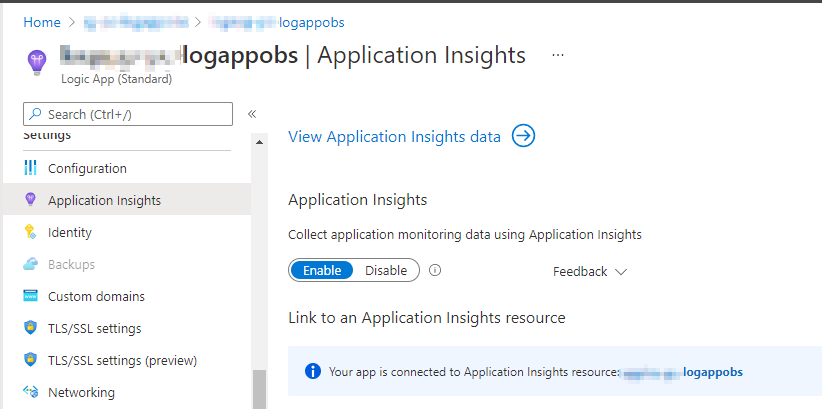
Figure 13. Enabling Application Insights integration
Log Analytics Integration
The Logic Apps consumption SKU provides direct integration with Log Analytics. As described in the previous section, Logic Apps Standard is integrated with Application Insights. However, Application Insights can be configured to be workspace-based. In other words, all logs and metrics of multiple Applications Insights instances can be ingested and aggregated into one Log Analytics workspace. This allows running queries across multiple Application Insights instances aggregates in the same workspace.
Wrapping Up
In this post, we’ve covered the different built-in observability features that we get in Logic Apps Standard. In the next post of the series, we will see how these features can be leveraged and implemented using a sample solution.
Cross-posted on Paco's blog
Follow Paco on @pacodelacruz