

Overview
In the previous post of the series, we’ve covered the different built-in observability features that are available in Logic Apps Standard and how many of them are part of the traces sent to Application Insights. In this post, we’ll discuss how these features can be implemented in a sample scenario. The series is structured as outlined below:
- Introduction – describes the built-in observability features available in Logic Apps Standard.
- Sample implementation (this article) – shows how these features can be leveraged and implemented.
- Querying and analysing Logic Apps traces – shows how to query and analyse Logic Apps application traces, and how to publish and share queries and charts.
The code of the solution shown in this post is available on GitHub.
Scenario
To demonstrate how to leverage these observability features in Logic Apps, I’ll use a very common integration scenario: the publishing and consumption of user updated events. Think of an HR or CRM system pushing user updated events via webhooks for downstream systems to consume.
To better illustrate the scenario, let’s describe the different components of the end-to-end solution.
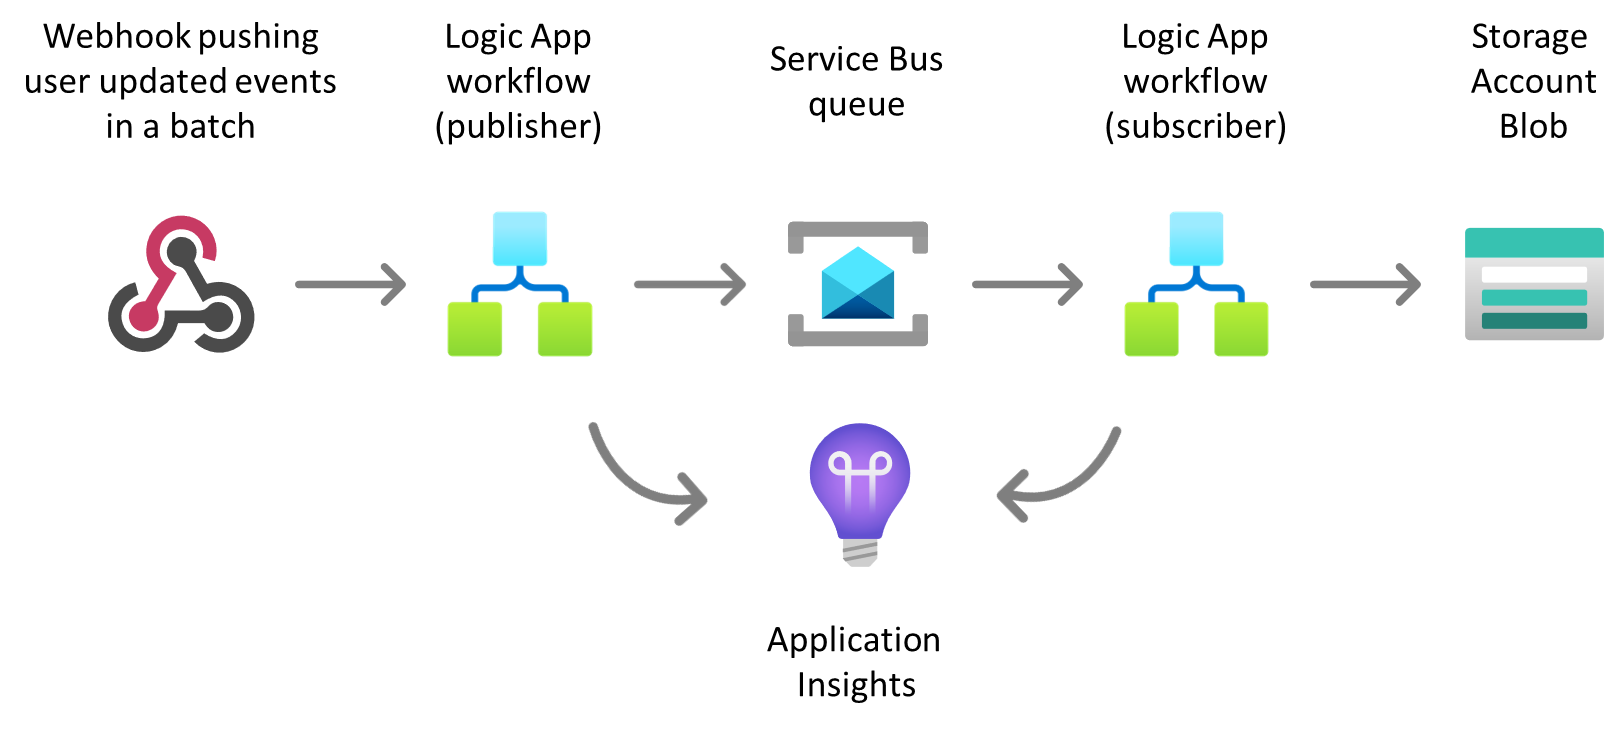
Figure 1. Sample scenario components
- Webhook - an HR or CRM system pushing user updated events via webhooks as an array of events and expects an HTTP response.
- Logic Apps workflow publisher - receives the HTTP POST request from the webhook, validates the batch message, splits the message into individual event messages, publishes the messages into a Service Bus queue, and returns the corresponding HTTP response to the webhook.
- User updated Service Bus queue - used to send and receive individual user updated event messages.
- User updated Logic App workflow subscriber – listens to messages in the queue, performs the required validations and message processing, and delivers the message to Azure blob storage.
- Azure blob storage – simulates a target system that needs to be notified when users are updated, but requires an integration layer to do some validation, processing, transformation, and/or custom delivery.
- Application Insights – ingests all diagnostic traces from Logic App workflows.
Publisher Workflow
The figure below shows the Logic App publisher workflow.
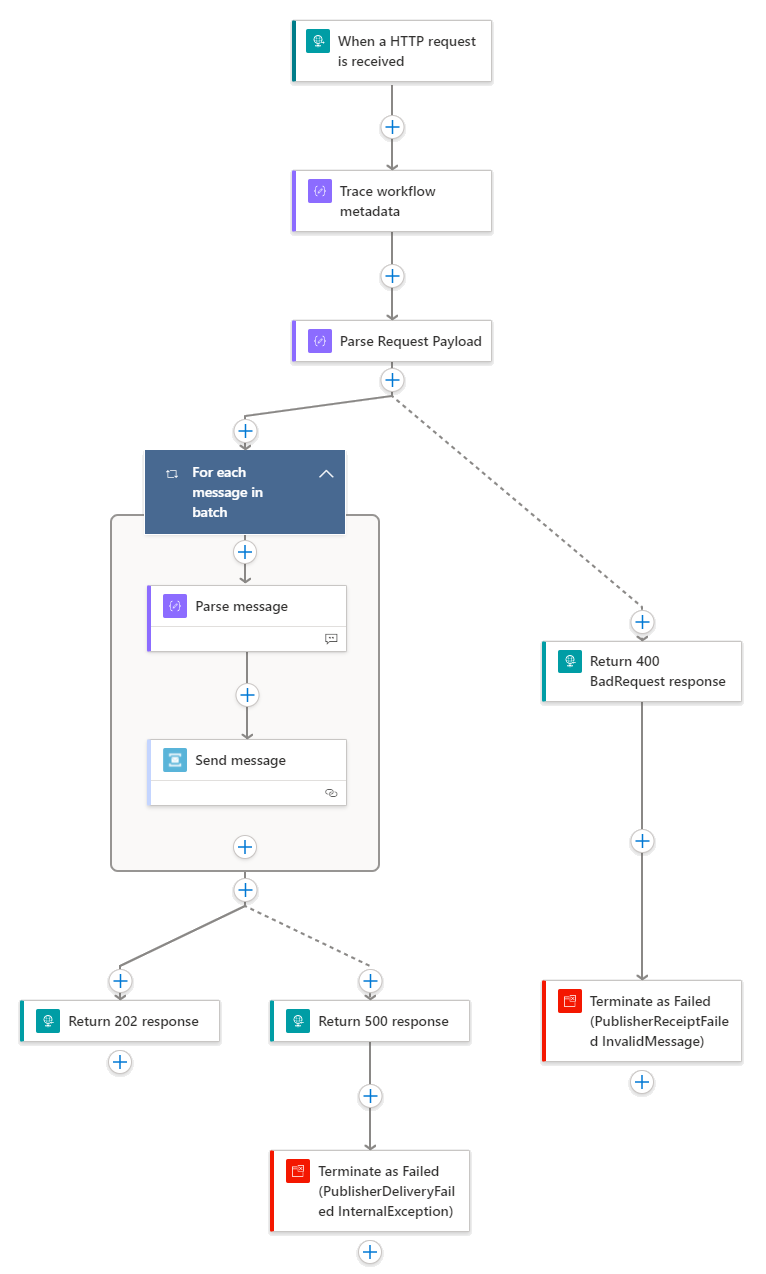
Figure 2. Publisher workflow
The workflow’s steps are described as follows:
- The workflow is triggered with an HTTP request.
- An
InterfaceIdis tracked usingtrackedProperties. - The request payload is parsed to validate the payload against the expected schema.
- If the received payload is valid
- For each individual event,
- The individual event message is parsed so that the different elements can be used further in the designer.
- The individual event message is sent to Service Bus
- If all individual messages were successfully sent to Service Bus
- Return a 202 Accepted response.
- Otherwise,
- Return a 500 Internal Server error response
- Terminate the workflow as failed with a custom error code and error message.
- For each individual event,
- If the received payload is invalid
- Return HTTP 400 Bad Request
- Terminate the workflow as failed with a custom error code and error message.
The code behind the workflow can be explored on GitHub.
The observability practices implemented in this workflow are detailed below and follow the practices described in the previous post.
- Application Insights integration is enabled for the Logic App.
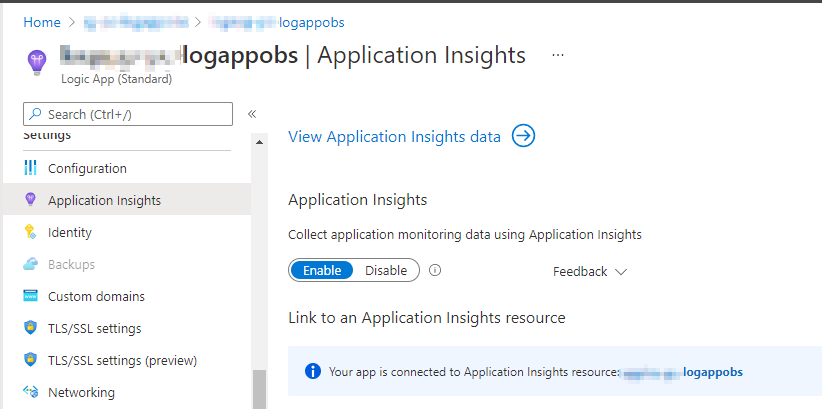
Figure 3. Enabling Application Insights integration
- A custom tracking id is being logged using a property in the JSON trigger body. This configuration and and code behind are shown below.
![]()
Figure 4. Configuring the custom tracking id property
"triggers": {
    "manual": {
        "correlation": {
            "clientTrackingId": "@{coalesce(triggerBody()?['id'], guid())}"
        },
        "inputs": {},
        "kind": "Http",
        "type": "Request"
    }
}
Code snippet 1. Configuring clientTrackingId in a HTTP trigger
- Tracked properties in a
Composeaction are being used to log an interface identifier. The code behind this action is shown below.
"Trace_workflow_metadata": {
    "inputs": {
        "InterfaceId": "USER.SVC01.P01v1"
    },
    "runAfter": {},
    "trackedProperties": {
        "InterfaceId": "@{outputs('Trace_workflow_metadata')?['InterfaceId']}"
    },
    "type": "Compose"
}
Code snippet 2. Configuring trackedProrperties in a compose action
RunAftersetting is being used for error handling. The code view of an action implementingrunAfteris included below.
"Return_400_BadRequest_response": {
    "inputs": {
        "body": {
            "ActivityId": "@{workflow().run.name}",
            "Message": "Bad request. Invalid message.",
            "StatusCode": 400
        },
        "statusCode": 400
    },
    "kind": "http",
    "runAfter": {
        "Parse_Request_Payload": [
            "Failed"
        ]
    },
    "type": "Response"
}
Code snippet 3. Configuring error handling using runAfter
- When applicable, a
terminateaction withfailedstatus is used adding a custom error code and error message. The code view of aterminateaction used in this workflow is shown below.
"Terminate_as_Failed_(PublisherReceiptFailed_InvalidMessage)": {
    "inputs": {
        "runError": {
            "code": "PublisherReceiptFailed_InvalidMessage",
            "message": "Invalid HTTP request payload received in publisher interface."
        },
        "runStatus": "Failed"
    },
   "runAfter": {
        "Return_400_BadRequest_response": [
            "Succeeded"
        ]
    },
    "type": "Terminate"
}
Code snippet 4. Using a terminate action with custom error code and error message
Subscriber Workflow
The figure below shows the Logic App subscriber workflow.
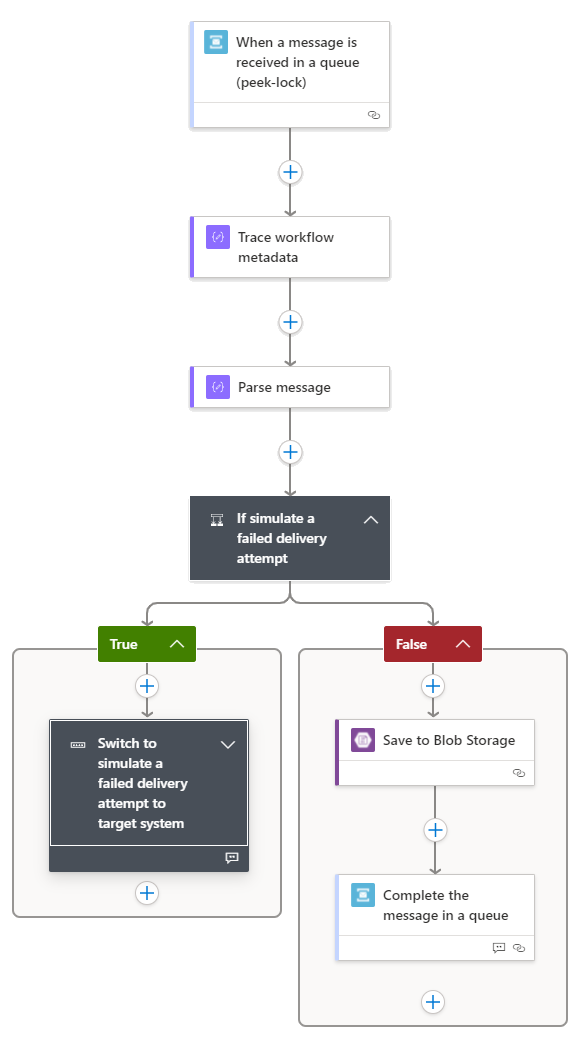
Figure 5. Subscriber workflow
The workflow steps are described as follows.
- The workflow is triggered by a message in a Service Bus queue.
- An
InterfaceIdis tracked usingtrackedProperties. - The event message is parsed so that the different elements can be used in the designer.
- Based on some values in the payload, the message can be delivered to the target system (blob) or a failed attempt can be simulated.
- If a failed attempt is to be simulated
- Depending on the content, the workflow is being terminated with different error codes.
- In some cases, the message is immediately dead-lettered.
- In some other cases, the message is being completed.
- In some other cases, the message is not settled, so that it becomes available for processing again after the lock expires.
- In some of these cases, the workflow is terminated as failed, and the delivery count is included in the custom error message.
- Otherwise,
- The message is delivered to Azure blob (target system)
- The message is completed from the Service Bus queue.
The code behind the workflow can be explored on GitHub.
The observability practices implemented in this workflow are detailed below and follow the practices described in the previous post.
- As shown previously, Application Insights integration is enabled for the Logic App.
- A custom tracking id is being logged using a property in the JSON trigger body. The code behind the trigger is shown below.
"triggers": {
    "When_a_message_is_received_in_a_queue_(peek-lock)": {
        "correlation": {
            "clientTrackingId": "@{if(empty(triggerBody()), guid(), triggerBody()['Properties']?['ClientTrackingId'])}"
        },
        "inputs": {
            "host": {
                "connection": {
                    "referenceName": "servicebus"
                }
            },
            "method": "get",
            "path": "/@{encodeURIComponent(encodeURIComponent('user-updated'))}/messages/head/peek",
            "queries": {
                "queueType": "Main"
            }
        },
        "recurrence": {
            "frequency": "Second",
            "interval": 10
        },
        "type": "ApiConnection"
   }
}
Code snippet 5. Configuring clientTrackingId for a Service Bus trigger
- As in the publisher workflow,
trackedPropertiesin acomposeaction are used to log an interface identifier. The code behind this action is shown below.
"Trace_workflow_metadata": {
    "inputs": {
        "InterfaceId": "USER.SVC01.S01v1"
    },
    "runAfter": {},
    "trackedProperties": {
        "InterfaceId": "@{outputs('Trace_workflow_metadata')?['InterfaceId']}"
    },
    "type": "Compose"
}
Code snippet 6. Configuring trackedProperties in a compose action
- Similarly, the
runAftersetting is used for error handling. - Likewise, when applicable, a
terminateaction withfailedstatus is used with a custom error code and error message.
Wrapping-Up
In this post, I’ve described a sample implementation of a publish-subscribe scenario using Logic App Standard and how the different observability practices described previously can be implemented in the corresponding workflows. In the next and final post of the series, I’ll describe how the different traces that result from these practices can be queried and analysed using Kusto Query Language.
Cross-posted on Paco's blog
Follow Paco on @pacodelacruz