

Introduction
As developers, we tend to focus our efforts on building and shipping our services and apps to production, but it’s quite common that we forget to think about what happens after go-live. Once we reach production, the solution becomes someone else’s problem. But, even if we could build bug-free services, distributed systems will fail. And if we don’t design and build our services with traceability and observability in mind, we won’t give the means to the operations team to troubleshoot problems when they arise. This is particularly important when our services are running in the background and there is no user interacting with the application. It might take a while to realise that there was an issue in production and a lot of effort to understand what happened.
Azure Functions is a fully managed serverless compute platform that allows us to implement backend services with increased productivity. Azure Functions provides very rich inbuilt telemetry with Application Insights. In a previous post, I described how to implement distributed structured logging in Azure Functions in a way that you can correlate custom log events created in different functions. This time, I’m writing a new series of posts that describes how to implement custom tracing and some observability practices in Azure Functions to meet some of the common requirements that operations teams have by adding business-related metadata while also leveraging the structured logging capabilities.
The approach suggested in this series works well in integration solutions following the publish-subscribe integration pattern, implemented using Azure Functions. It also considers the splitter integration pattern. Bear in mind that this approach is opinionated and based on many years of experience with this type of solutions. Similar practices could be used in other types of scenarios, such as synchronous APIs.
This post is part of a series outlined below:
- Introduction (this article) – describes the scenario and why we might need custom distributed tracing in our solution.
- Solution design – outlines the detailed design of the suggested solution.
- Implementation – covers how this is implemented using Azure Functions and Application Insights.
Scenario
To demonstrate how to implement custom distributed tracing and observability practices with Azure Functions, I’ll use a common scenario, the publishing and consuming of user update events. Think of a HR or CRM system pushing user update events via webhooks for downstream systems to consume. To better illustrate the scenario, let’s follow a high-level sequence diagram that has the following participants:

- Webhook - an HR or CRM system pushing user update events via webhooks, which sends an array of user events and expects a HTTP response.
- User Updated Publisher Azure Function - receives the HTTP POST request from the webhook, validates the batch message, splits the message into individual event messages, publishes the messages into a Service Bus queue, and returns the corresponding HTTP response to the webhook.
- User Updated Service Bus queue - receives and stores individual user event messages for consumers.
- User Updated Subscriber Azure Function – listens to messages in the queue, performs the required validations and message processing, and delivers the message to the target system.
- Target System – any system that needs to be notified when users are updated, but requires an integration layer to do some validation, processing, transformation, and/or custom delivery.
The process in this scenario could be depicted through the sequence diagram below. The numbered flows in the diagram are detailed after.
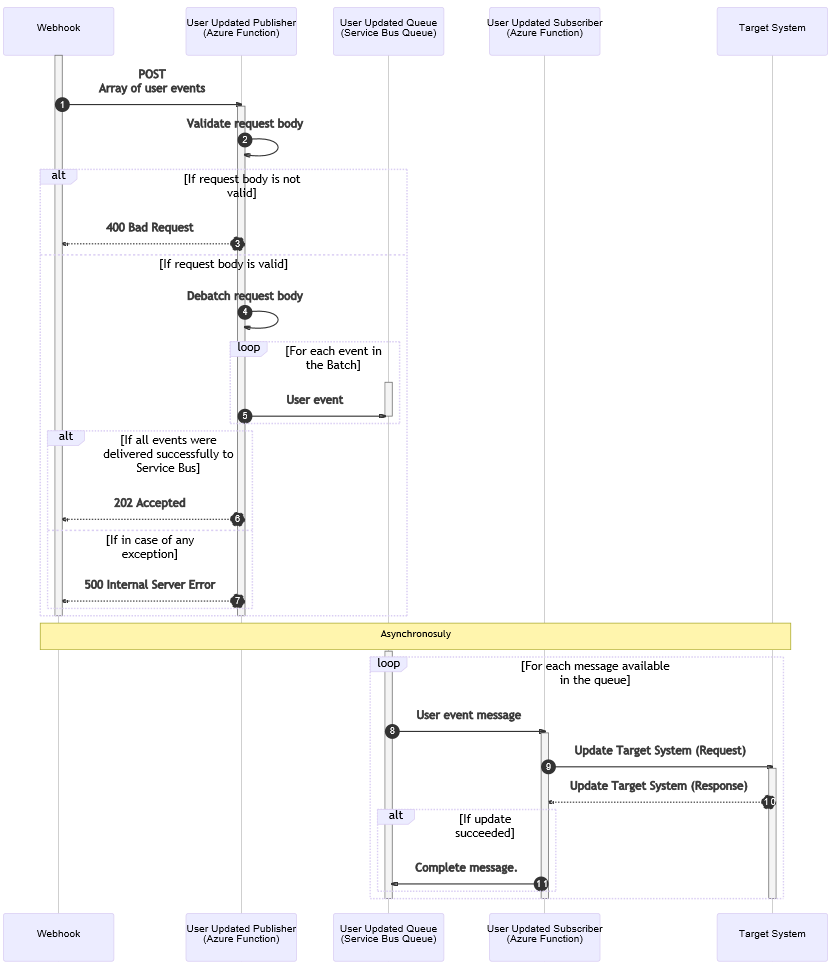
- A webhook pushes user update events in batch to the User Updated Publisher Azure Function (publisher function) via a HTTP post.
- The publisher function validates the request payload.
- If the request payload is invalid: The publisher function returns HTTP 400 – Bad Request to the webhook.
- If the request is valid: The publisher function splits the body into individual event messages (splitter pattern).
- For each message event in the batch: The publisher function sends the user event message to the Service Bus queue.
- If all event messages were successfully delivered: The publisher function returns HTTP 202 Accepted to the webhook.
- In the case of any exception: The publisher function returns HTTP 500 – Internal Server Error to the webhook.
Asynchronously (temporal decoupling provided by Service Bus queues), and for each message available in the queue:
- The User Updated Subscriber Azure Function (subscriber function) gets triggered by the user event message in the queue.
- The subscriber function tries to deliver the message to the target system via a request.
- The target system returns a response with the update request result.
- If the update operation succeeded: The subscriber function completes the message, so it is deleted from the queue.
- If the update operation was not successful, the message becomes available again for a retry after the message lock expires. When all attempts are exhausted, the message is dead lettered by the queue.
Operations Requirements
Now let’s think of what an operations team might need to support a solution like this in an enterprise and what we could offer as part of our design to meet their requirements.
The table below includes some of the common requirements from an operations perspective and what features we could offer to meet them. The right side of the table is a good segue into the next post of the series, which covers in more detail the solution design.
|
Requirement |
Potential Solution |
|
Being able to inspect incoming request payloads for troubleshooting purposes. |
Archive all request payloads as received. |
|
Being able to correlate individual messages to the original batch and understand whether all messages in a batch were processed successfully. |
Capture a batch record count and a batch identifier in all tracing events for individual messages. |
|
Ability to correlate all tracing events for every individual message. |
Capture a tracing correlation identifier in all tracing events for every message. |
|
Being able to find tracing events for a particular message. |
Capture business-related metadata in all relevant tracing logs, including an interface identifier, message type, and an entity identifier. |
|
Receive alerts when certain failures occur. |
Capture granular tracing event identifiers and tracing event statuses. |
|
Being able to differentiate transient failures. |
Capture a delivery count when messages are being retried to identify when additional attempts are expected or when all attempts have been exhausted for a particular message. |
|
Ability to query, filter, and troubleshoot what happens to individual messages in the integration solution. |
Implement a comprehensive custom distributed tracing solution that allows correlation of tracing events, including tracing correlation identifiers, standard tracing checkpoints, granular event identifiers, status, and business-related metadata. |
Wrapping Up
In this post, I discussed why it is important to consider traceability and observability practices when we are designing distributed services, particularly when these are executed in the background with no user interaction. I also covered common requirements from an operations teams supporting this type of services and described the scenario we are going to use in our sample implementation. In the next post, I will cover the detailed design of the proposed solution using Azure Functions and other related services.
Cross-posted on Paco’s Blog
Follow Paco on @pacodelacruz