
Recently on a client engagement, I needed to extract some real-time metrics from some Mule pods running in an OpenShift environment. At that point in time, we were engaged in a performance testing activity, and while the tests were actually passing successfully, the lack of visibility into the pods made me nervous. I at least wanted to understand how the basic metrics such as CPU, heap space, threads etc. were behaving.
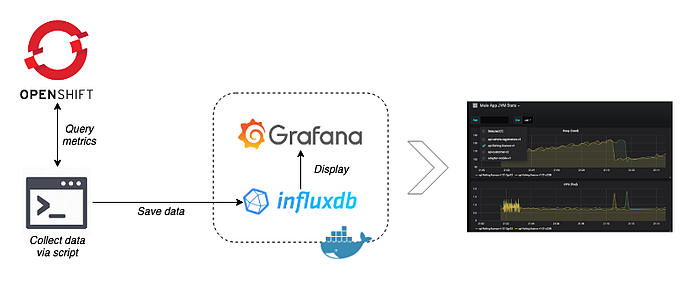
Given a monitoring tool had not yet been deployed, I made use of Jolokia within OpenShift to retrieve these metrics. The beauty of Jolokia is that it is a JMX-HTTP bridge and provides a lightweight approach to remote application monitoring via REST/JSON. The applications within OpenShift should ensure that both Jolokia is included in the docker image and the image exposes the Jolokia port (8778). Once this is in place, the metrics are ripe for picking. However, simply retrieving the metrics was only part of the solution and by itself was not sufficient. Therefore, I needed to write a script to regularly retrieve these metrics, push them into a time series database (InfluxDB) and then use a dashboarding tool (Grafana) to display it in real-time.
Through the course of this post, I will give an overview of how I put this together, and provide the scripts and docker image with Grafana and InfluxDB included. My goal here is for others to be able to quickly leverage these scripts in their local environments and attain a higher level of visibility into their pod's JVMs using freely available tools.
Prerequisites
In order to run the script and use the Docker image given below, it is important you have the following installed locally:
You will also need a valid user login for the OpenShift environment you're targeting (the script makes use of the oc authentication token when invoking the Jolokia API)
Jolokia Agent - show me the metrics
Our entry point into the OpenShift environment for our task is via the Jolokia agent. It exposes different endpoints via REST that you can query to retrieve the metrics of a particular pod's JVM. Each pod has its own URL, and further to that, each MBean that provides a given metric has its own resource path. Therefore, to retrieve a single metric at a given point in time for a particular pod, one HTTP call needs to be made. For efficiency gain, it's possible to perform bulk requests, however, I haven't implemented that here.
This blog post on the RedHat Developer blog is most helpful for diving into Jolokia on OpenShift. In addition, the full documentation for Jolokia can be found here.
See the following cURL example (The Bearer token is retrieved via oc whoami -t)
curl --insecure \
 -H "Authorization: Bearer jHDBX6YD_IaMzGZLY1b8Vl6THkJ49nSdvaW6I3yN6J8" \
 https://my.non-prod.openshift.env:8443/api/v1/namespaces/dev/pods/https:api-payment-v1-310-qc960:8778/proxy/jolokia/read/java.lang:type=Memory/HeapMemoryUsage

{"request":{"mbean":"java.lang:type=Memory","attribute":"HeapMemoryUsage","type":"read"},"value":{"init":268435456,"committed":192937984,"max":239075328,"used":148453608},"timestamp":1554897972,"status":200}
The above example was a snapshot at that point in time for the heap memory usage for that pod. It is used ~141MB out of ~228MB. Good to know but not particularly valuable without any temporal context. So, to make this better, we're going to need to do this for multiple pods, retrieving half a dozen metrics, every 10 seconds or so. That is going to be quite a few HTTP requests and not something we'll do by hand via the shell. Time for some scripting!
Groovy to the rescue
Groovy is great to work with and it has some handy libraries that will help us out here. Before we progress to the later stages of populating InfluxDB and using Grafana we first need to set our script up to collect the data. While this script is provided in full at the bottom of this post, it is worth stepping through the major functions to understand how we arrived at the solution. The script has the following key steps:
- Get pod names from OpenShift
- Instantiate a RESTClient
- Query metrics and display on the console
a. Get pod names from OpenShift
Each time a container is created in OpenShift, it is given a new suffix, while the application name stays the same. This helper method gives us a way to deal with this dynamic aspect. When starting the script, we simply provide the application name, e.g. "api-payment-v1" and let the helper method invoke the OpenShift API and traverse the JSON response in order to resolve it to the actual pod name. At this point in time for example, it is "api-payment-v1-151-l4156" (there will potentially be more pods depending on scaling).
b. Instantiate a RESTClient
We can make use of the groovyx.net.http.RESTClient library in order to create a REST client pointing at the Openshift base URL. It is from here we will invoke the Jolokia agent.
c. Query metrics and display on the console
In this step, we display the header row in the console, before running a TimerTask. Each iteration of the TimerTask will loop over the application's pods, hitting the Jolokia endpoint for each JVM metric we are interested in before adding it to a map. Note the example below has two MBeans, and in the actual script, I used seven as this was all I was interested in. You can do a lot more with Jolokia, and just skimming the documentation really highlights this.
Putting it together
Running the script gives the following output:
$> groovy CollectMuleJvmMetrics.groovy \
  --app api-payment-v1 \
  --token $(oc whoami -t) \
  --env dev
Getting metrics for apps [api-payment-v1] in env dev
Setting jolokia URL: https://my.non-prod.openshift.env:8443
app,instance,env,created_ts,memory_heap_used,memory_heap_committed,memory_non_heap_used,memory_non_heap_committed,cpu_load_process,cpu_load_system,thread_count,thread_count_peak
api-payment-v1,api-payment-v1-310-qc960,dev,1554900075116,148.98,184.00,143.24,147.13,0.02,33.77,420,420,15737
api-payment-v1,api-payment-v1-310-qc960,dev,1554900085115,161.90,184.00,143.31,147.13,2.10,24.09,420,420,15737
api-payment-v1,api-payment-v1-310-qc960,dev,1554900095120,161.71,184.00,143.36,147.13,2.02,28.23,420,420,15737
api-payment-v1,api-payment-v1-310-qc960,dev,1554900105121,150.73,184.00,143.38,147.13,2.09,22.30,420,420,15737
api-payment-v1,api-payment-v1-310-qc960,dev,1554900115124,148.64,184.00,143.40,147.13,1.97,21.69,420,420,15737
api-payment-v1,api-payment-v1-310-qc960,dev,1554900125127,149.30,184.00,143.44,147.13,2.54,30.02,420,420,15737
Note: in our case the OpenShift projects were used to logically divide into environments (dev, sit, uat, etc), hence the references to the environment in the script (env argument).
The happy couple: InfluxDB and Grafana
Now that we have our data collection sorted out, let's make things infinitely more user-friendly by applying some dashboarding. Firstly, we need to push the metrics into a time series database. InfluxDB is a very popular open source time series database written in Go, and it is what we will be using here. Grafana is also open source and ideal for time series analytics, and especially helpful is the fact that it ships with a feature-rich data source plugin for InfluxDB!
To make things easier, I adapted an existing Docker image that was freely available and made some tweaks for added convenience. Therefore, instead of providing steps on setting these tools up from scratch, we will simply get the Docker image up and running.
Prepare local mount locations
- Create two directories for the working paths of InfluxDB and Grafana, e.g.:
/path/for/influxdb
/path/for/grafana
These are mounted to /var/lib/influxdb and /var/lib/grafana respectively. - Grafana provisioning: to help bootstrap Grafana with pre-configured data sources and dashboards, clone or download the following branch: https://github.com/jamesgarner-me/docker-influxdb-grafana/tree/feature-upgrade-infux-grafana-versions
This will be mounted to /etc/grafana/provisioning/
The mapped ports are Grafana, InfluxDB-admin, InfluxDB and SSH respectively
To run the container:
docker run -d \
   --name docker-influxdb-grafana \
   -p 3003:3003 \
   -p 3004:8083 \
   -p 8086:8086 \
   -p 22022:22 \
   -v /path/for/influxdb:/var/lib/influxdb \
   -v /path/for/grafana:/var/lib/grafana \
   -v /path/to/cloned/repo/grafana/provisioning/:/etc/grafana/provisioning/ \
   jamesagarner/docker-influxdb-grafana:latest
Once the pull is complete, the Docker container should be running. Check Grafana is up by opening http://localhost:3003 in a browser (username and password of root/root)
Populate some time series data
Let's run our script again, this time providing an extra argument dbUrl. The presence of this argument tells the script to also push the data to InfluxDB via the URL provided. You can have a look at the source of the script to understand how it pushes to InfluxDB but essentially, we once again make use of the RESTClient library in Groovy to perform a HTTP POST of the data in binary form for each row inserted. The database name is set to data in the script and in the preconfigured InfuxDB data source in Grafana.
$> groovy CollectMuleJvmMetrics.groovy \
 --app api-payment-v1 \
 --token $(oc whoami -t) \
 --env dev \
 --dbUrl http://localhost:8086/
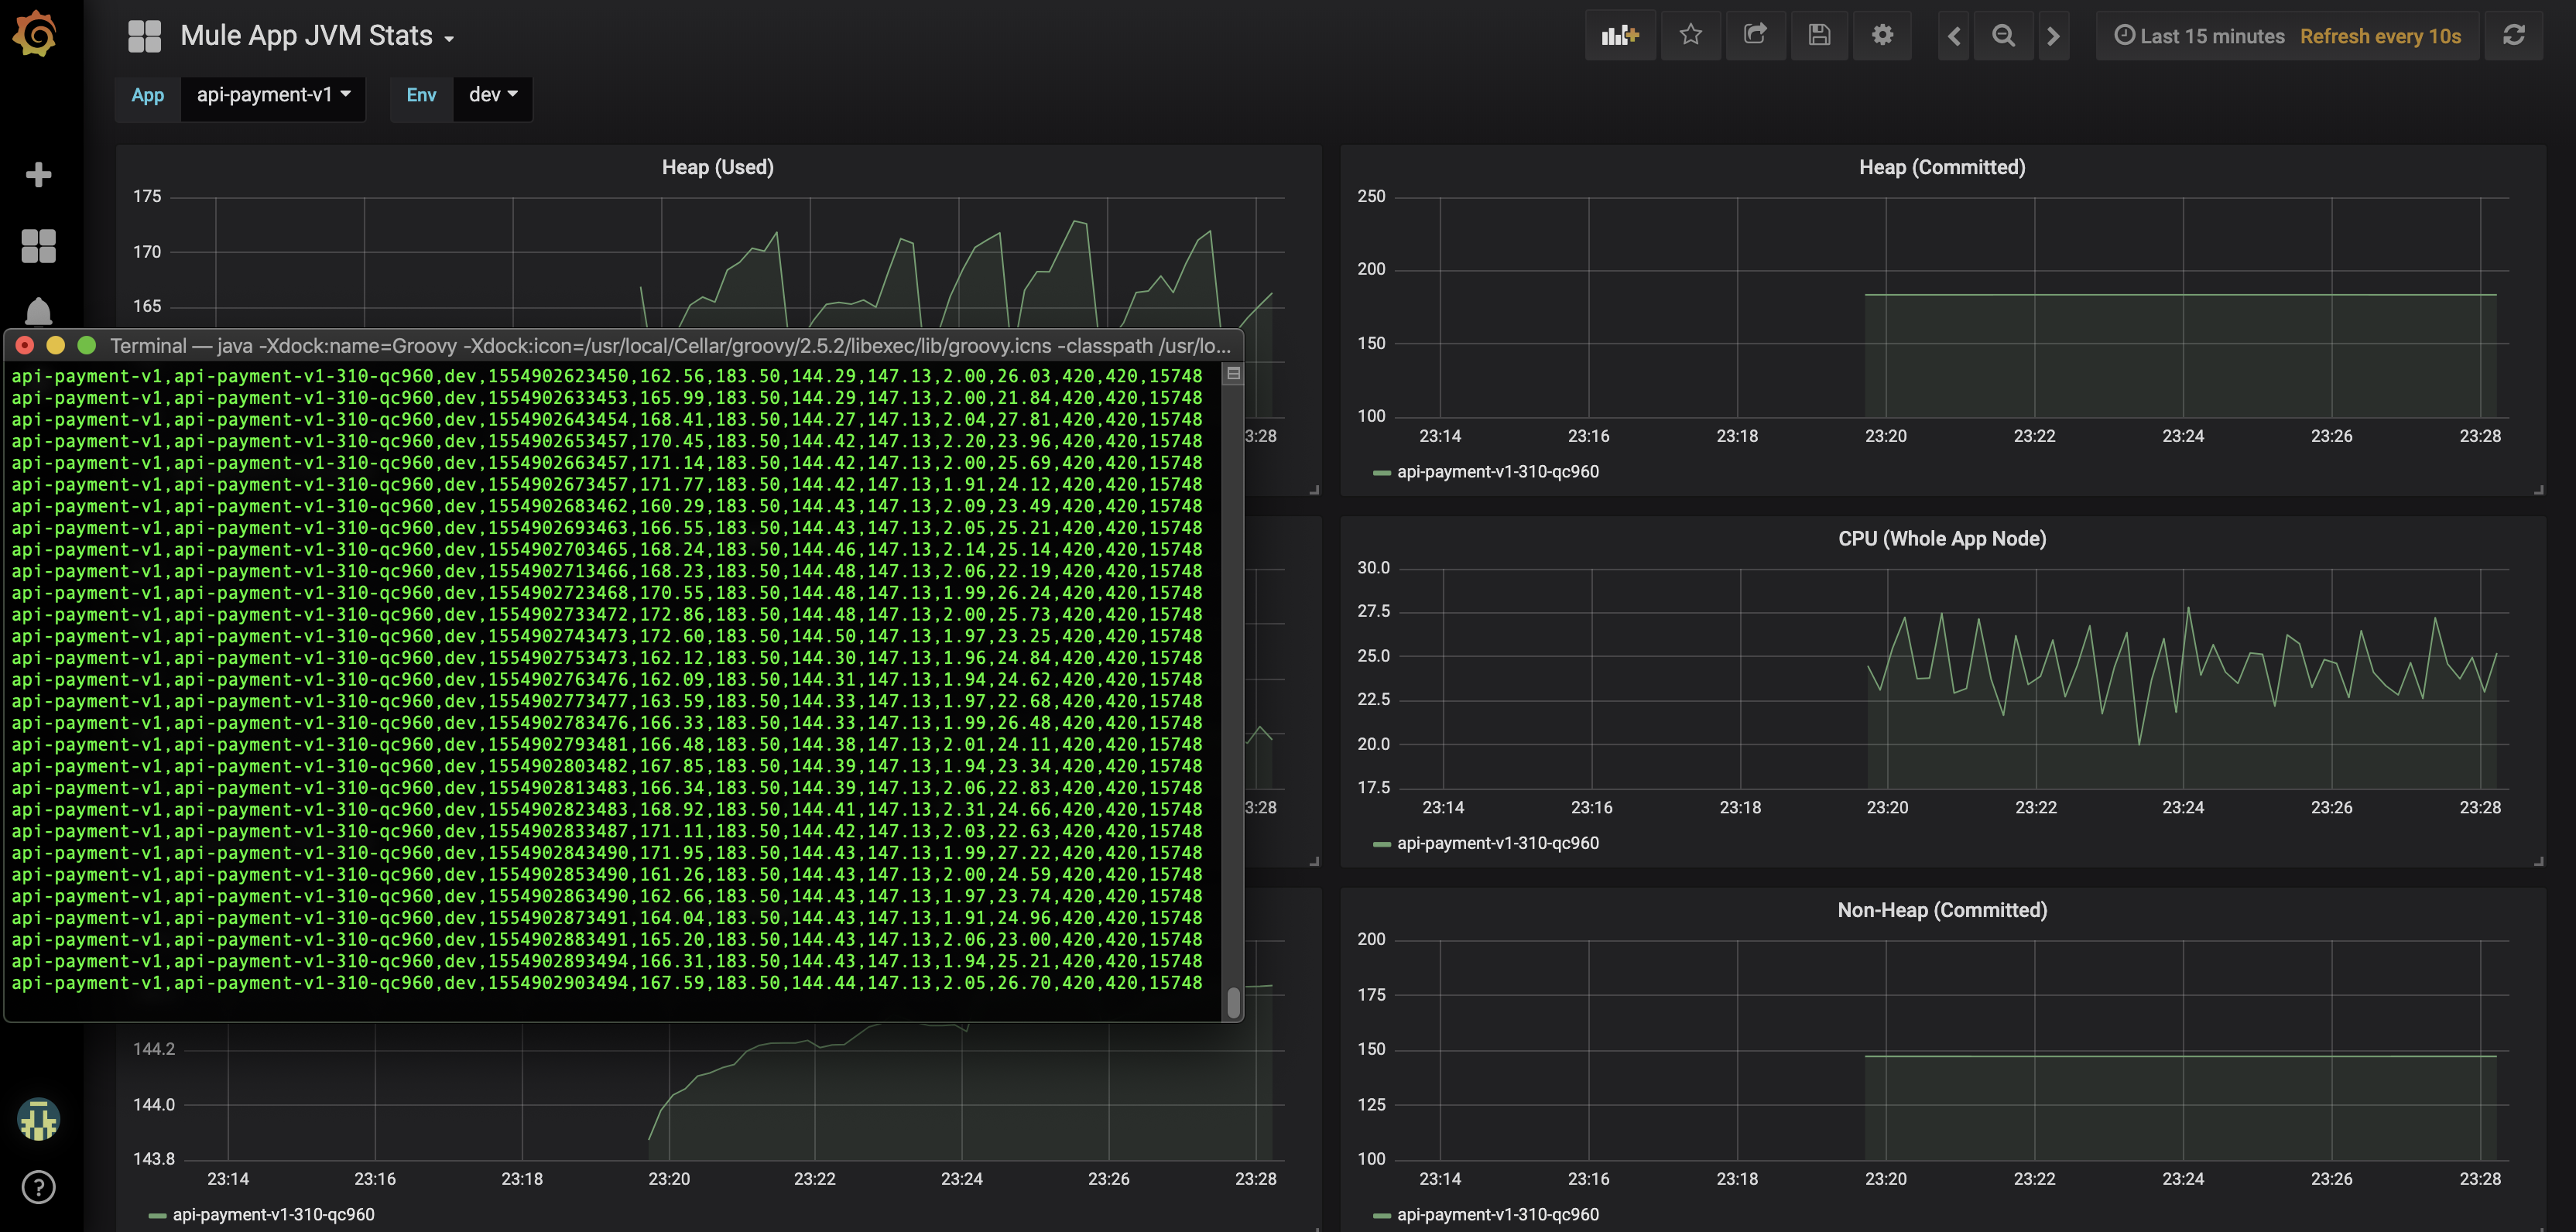
The script will start and we will see the ticker of metrics displayed in the console. The script is also now pushing the metrics to InfluxDB. If we once again open up Grafana in a browser, and bring up the Mule App JVM Stats dashboard, we should see the JVM metrics displayed!
Improvements
I put this solution together over the course of a couple of weeks as a background task so of course, there is room for optimisation, for example:
- The OpenShift environment names are part of the definition of the Grafana dashboard. Your environments will probably be different. If so these can be updated between lines 1052 and 1091 of the file grafana/provisioning/dashboards/jvm-stats-dashboard.json
- The script could be made more robust in the area of determining the OpenShift pods - if there are any pods that are in an error state, for example a stale deployment, then the script will still pick these up and attempt to query them, resulting in an error.
- Achieve efficiency gains in the script by using JMX bulking requests - https://jolokia.org/features/bulk-requests.html
- It may be possible to configure a system account in your OSE so you can use a token that doesn't expire
Conclusion
The use of the Jolokia agent as a JMX-HTTP bridge is very useful for the monitoring and management of distributed applications where the old school RMI approach no longer applies. We are able to use scripted Jolokia calls to retrieve JVM metrics from OpenShift containers, because they have the Jolokia agent installed and exposed often by default. Combining this with a time series database and a dashboard makes it very useful to observe the behaviour of your applications in real time. An approach like this could be a helpful interim measure in the absence of a more sophisticated application monitoring product.
Appendix
Link to complete script: https://gist.github.com/jamesgarner-me/3d21d05adc0725b19cde0f279cc11930