Recently we helped a client deploy an on-premises ESB platform based on Mule ESB and Apache ActiveMQ. The platform uses JMS queues between ESB services and adapters to provide load balancing and fault tolerance across active/active Mule servers.
The ESB is a strategic IT asset for our client and so went through extensive testing for throughput and availability. We felt the most illuminating test was the ‘Soak Test’: effectively an 8-hour long Denial of Service attack on our own middleware layer to prove it could handle the load, keep serving requests and come out the other side still standing.
During early Soak Test runs, our soapUI test harness recorded that throughput would slowly fall by almost 70% over 4 hours, then suddenly recover and begin the cycle again.
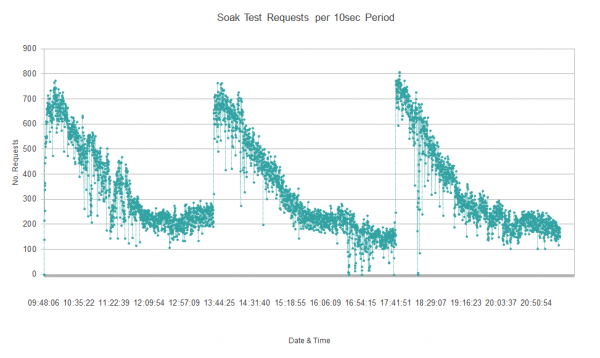
Some initial investigation showed that the Mule servers (which do most of the work) would drop to 50% utilisation, suggesting the problem was in the ActiveMQ messaging layer. The gradual drop in performance suggested a resource leak of some description. Since ActiveMQ is a Java application, the first place to look was the JVM and its Garbage Collection (GC) behaviour.
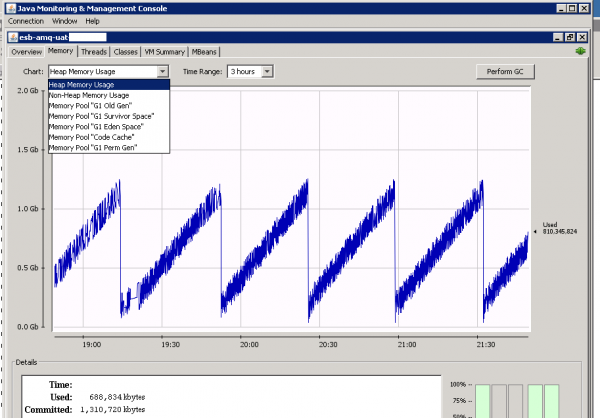
Tuning without data is impossible, so our first step was to enable verbose GC logs on the ActiveMQ JVMs and connect to them via JMX with the JConsole utility to collect JVM statistics.
Running the Soak Test with this instrumentation confirmed our suspicions: full GC cycles were occurring in alignment with the times of lowest throughput and the logs showed GC pauses getting longer and more frequent as the heap filled up.
Exacerbating the problem was our setting of a small initial heap size and large maximum heap size. This caused the GC to establish progressively higher memory ‘ceilings’ (1GB, 2GB, 4GB) and spend lots of GC time trying to stay under those artificial limits before giving up and either raising the ceiling or doing a full GC cycle.
Armed with some real data, we were ready to start tuning. We started by thinking about the kind of performance we wanted from our message broker and the trade-offs we could make:
- Most of the ESB’s traffic would be synchronous request/response so low average latency would be important (i.e. minimise the time spent performing GC).
- As shared infrastructure we wanted latency to be predictable (i.e. avoid very long GC pauses even if they are infrequent).
- Finally ActiveMQ would have to stay running for long periods so we wanted to avoid heap fragmentation (i.e. choose a GC algorithm that compacts the heap).
Taking these goals in mind, we decided to give the G1 Garbage Collector a try. G1 is a new GC algorithm in Oracle’s Java 7 (and OpenJDK). You specify a GC pause time target and it frees as much memory as it can in the allotted time. It is a compacting collector too (unlike the popular Concurrent Mark Sweep collector) so there is less risk of heap fragmentation after the JVM has been running for a long time.
To combat the problem with heap size ‘ceilings’ we switched to a fixed heap size of 1.2GB. The core ActiveMQ engine only uses 40MB so we still had plenty of memory headroom for in-flight messages.
Our tuning parameters now looked like this:
-Xmx1280M –Xms1280M -XX:+UseG1GC
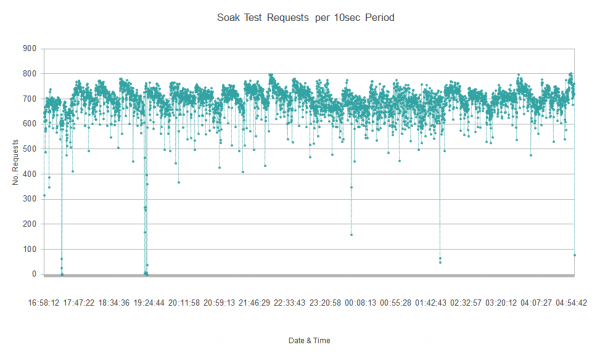
Running the Soak Test again, we saw much more consistent ESB throughput. However we were still seeing full GC cycles every 20 minutes or so.
Looking at the heap usage in JConsole, we saw that too many objects were getting promoted into the old generation and left there until a full GC cycle when they were found to be garbage anyway. To address this we increased the ratio of new:old heap region sizes, and raised the heap usage threshold at which full GC cycles would occur. This gave us tuning parameters of:
-Xmx1280M –Xms1280M -XX:+UseG1GC -XX:NewRatio=4 -XX:InitiatingHeapOccupancyPercent=75
This second round of tuning reduced the frequency of full GC cycles to every 45 minutes. We could have tuned further but other parts of the system became the bottleneck and we were already comfortably exceeding our performance requirements.
So in summary:
- Consider the G1 Garbage Collector for any server-side Java application. It has very predicable performance characteristics and is easy to tune.
- More memory is not always better. A larger heap means more memory for the GC to manage. Use only the memory your application needs.
- Set a fixed heap size for server-side apps (this is an age-old trick, but still relevant). Being frugal with memory makes sense for desktop apps but not when the whole server is dedicated to running just your JVM.